This article is a supplement to the ServiceNow documentation. For full
documentation please refer ServiceNow official website
Checkout our NEW
Video Channel you can like
and subscribe too!
Introduction
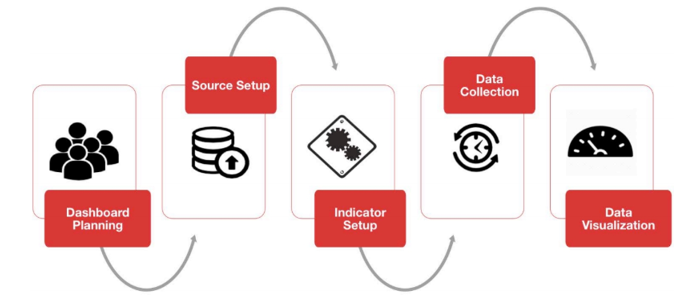
Performance Analytics visualizes business process data that is collected over time.This data reveals trends which can be used to make real time adjustments for continual service improvement.The following process describes the steps of performance Analytics deployment
Key Concepts of Performance Analytics
- KPIs (key performance Indicators)
- Scorecards
- Dashboards
- Widgets
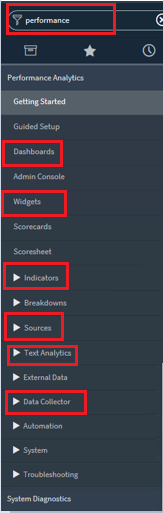
Login into ServiceNow instance.
In the left Navigation panel -> performance
All the sections under Performance Analytics will be displayed in the list view
Difference between Report and PA?
Report
- A snapshot of the process measured at
specific time. - Describes a process right now
- Provide a real time status updates example:How many changes are closed right now.
- Summary of past information.
- Reports are great for measuring process output when no trending is required.
Performance Analytics
- PA provides a trending information for process so that action can be taken as soon as performance degradation is detected.
- PA describes a process over a
period of time. - PA allows for advanced trend and business impact analysis enhanced with targets,thresholds,comparisons and trend forecasting.
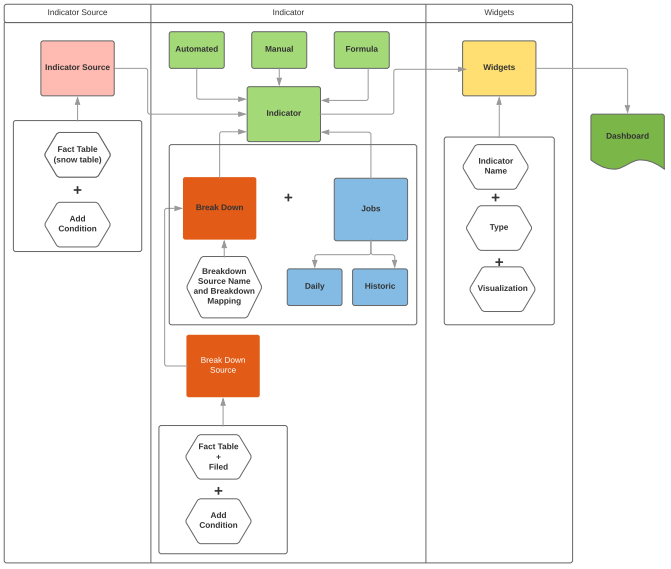
Setup Performance Analytics
- Set up the business data sources (Indicator Sources) from ServiceNow process tables.
- Build indicators to retrieve business data using different filter conditions and aggregates depending upon the desired measurements.
- Breakdown Sources are created to enable data categorization and navigation.
- Breakdown are created from Breakdown Sources.
- Indicators are associated with Breakdowns to provide dimensions for analysis.
- Collection is run on a regular basis to populate Sources,Indicators,Breakdowns.
- Build
widgetsto visualizeIndicator. - Create Dashboards and use the
widgetsto organize process indicators into a single place to track process health.
Read more
Content
- Understanding Request, RITM, Task in ServiceNow
- Steps to create a case in ServiceNow (CSM)
- Performance Analytics in 10 mins
- Event Management in 10 minutes - part1
- Event Management in 10 minutes - part2
- Custom Lookup List
- Script includes in 5 minutes
- Interactive Filter in 5 minutes
- UI Policy in 6 Minutes
- Client Side Script Versus Server Side Script in 3 minutes
YouTube Videos
-
Snow
- Performance Analytics
- ServiceNow Scripts
- Script include
- Useful scripts
- Basic Glide Scripts
- Client Script
- Advance Glide Script
- Glide System Script
- Admin
- Import Set
- Work Flow
- ACL
- SLA
- Notification
- Core Application
- UI Policy
- UI Action
- Client Script
- CAB Workbech
- Data Policy
- Connect Support
- Catalog
- Discovery
- CSM
- Event Management
- HR
- Integrations
- SSO Integration
- LDAP Integration
- SCCM Integration
- AWS Intergration
- Slack Integration
- CTI Integration
- Jira Integration
- Ebonding ServiceNow
- SOAP Integration
- IBM Netcool Integration
- VIP Mobile App Integration
- Rest Integration
- Service Portal
- Questions
Topics
- ACL
- Performance analytics(PA) Interactive Filter
- Various Configurations in Performance analytics(PA)
- Service Portal
- Performance Analytics(PA) Widgets
- Performance Analytics(PA) Indicator
- Performance Analytics(PA) Buckets
- Performance Analytics(PA) Automated Breakdown
- Client Script
- Rest Integration
- Understanding the Request, RITM, Task
- Service Catalogs
- Events in ServiceNow
- Advance glide script in ServiceNow
- CAB Workbench
Post By Date
Saturday, November 5, 2022
Monday, November 1, 2021
Friday, October 29, 2021
Sunday, May 9, 2021
Monday, April 19, 2021
Sunday, March 21, 2021
Saturday, March 20, 2021
Wednesday, January 20, 2021
Tuesday, January 19, 2021
Saturday, January 2, 2021
Sunday, July 5, 2020
Sunday, June 14, 2020
Saturday, June 13, 2020
Saturday, May 16, 2020
Saturday, May 9, 2020
Thursday, May 7, 2020
Wednesday, May 6, 2020
Tuesday, May 5, 2020
Sunday, May 3, 2020
Saturday, May 2, 2020
Thursday, April 30, 2020
Saturday, April 25, 2020
Friday, April 17, 2020
Saturday, April 4, 2020
Sunday, November 24, 2019
Wednesday, November 13, 2019
Wednesday, November 6, 2019
Saturday, November 2, 2019
Wednesday, October 30, 2019
Tuesday, October 29, 2019
Monday, July 29, 2019
Sunday, May 5, 2019
Thursday, April 4, 2019
Monday, April 1, 2019
Monday, March 25, 2019
Sunday, March 24, 2019
Monday, March 4, 2019
Sunday, May 8, 2016
Sunday, May 1, 2016
Author
Chandrima
With 9+ years of ITSM development experience,Chandrima likes to deep dive ServiceNow modules.She have extensively worked on PA,Service Portal,Event management.
Comments