Introduction
Indicators are statistics that business track to measure current conditions and forecast business trends.
Indicators are also known as metrics , business metrics or KPIs

An indicator is a definition of a measurement or a score related to a business process which needs to be captured and trended over time. Indicators require a source to obtain their data from.Multiple indicators can be created from the same indicator source and then differentiated via additional conditions.
The indicator source extracts a large record set. When configuring an indicator based on that source,use the indicator additional conditions to refine the data selection.
Three types of indicators
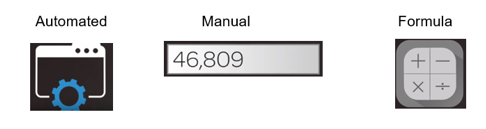
-
Automated: If you need to measure indicators on a daily basis,or you want to
eliminate any human involvement,using the data collector is the preferred method.The data collector enables you to definea set of jobsand use indicator definitions to collect scores.the data collector is activated with performance Analytics and needs to configured. -
Manual:: If you need to measure an indicator
once a month,quarter,oryear,use the manual interface or import the data via an import Set.Manual indicators may also be used to collect data from a 3rd party or for sensitive data.
Manual indicators are not associated with a source.
The characteristics of manual indicators
Scores for manual indicators are not collected automatically by a data collection job.
Populate Manual indicators by manually adding scores via the score sheet or by importing data.
Typically Manual indicators are used for data that is updated once a month or less.
Manual indicators are typically used for data that cannot be retrieved from the snow instance because it comes from an outside system.
Example: Our company does not have telephony data in any snow table.They do however have logs in their telephony system providing information about daily calls to the service desk.The total number of phone calls per-day can be exported into a CSV file from the telephony system and imported into snow .A manual indicator is needed to display the imported data.
Formula: We can use formula indicators to create new indicators based on the collected data from existing manual or automated indicators.
Just like a manual indicators, Formula indicators do not use indicator sources but do require an existing indicator to perform the formula calculations.
Note:There are situations when you do not want an indicator in the formula to do follow the breakdown selected on the dashboard widget.In the case,uncheck Allow Breakdowns when defining the formula.This results in enclosing the respective operand in curly brackets.
Example
[[number of new critical incidents]]/{number of new incident}
A breakdown (like category) is applied only to the numerator when viewing the data on a widget.So if the category breakdown selected the H/W category ,we would get the critical H/W incidents as a percentage of all incidents,not all H/W incidents.
[[number of new critical incidents > category = H/W]]/{number of new incident}*100
In this case a category breakdown will be applied to only the numerator. This results in calculating the critical H/W incidents as a percentage of all incidents,regardless of category.
[[number of new critical incidents > category = H/W]]/[[number of new incident > category = H/W]]*100
In this case a category breakdown will be applied to both the numerator and the denominator. This results in calculating the Critical H/W incidents as a percentage of al H/W incidents
Steps to create Indicator:
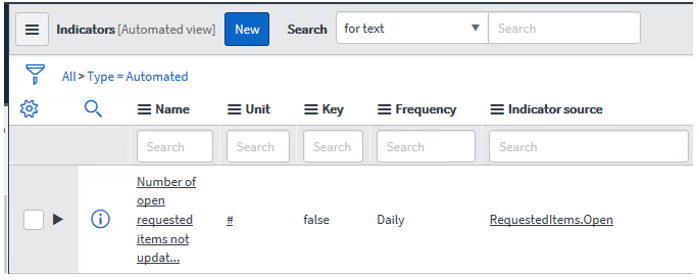
An automated indicator is based on an indicator source. The indicator source specifies a table and a frequency at which scores from this table are saved. After you select the indicator source and specify other properties, choose scheduled jobs to collect data for the indicator.
- Navigate to
Performance Analytics > Indicators > Automated Indicators.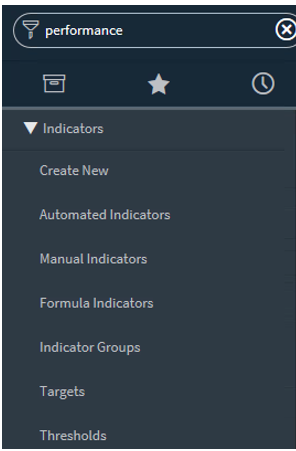
- Click New.
- In the Name field, give the indicator a descriptive name, e.g Number of Incidents closed.
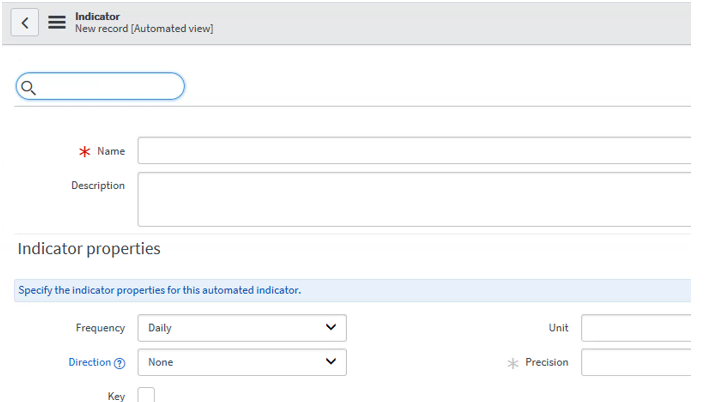
- We also need to set the Indicator source and set access control for this indicator. we can set the direction of the data trend based on which we can take corrective measures.
- Unit:
#,Day,%,etc. - Precision: Number of decimal places.
- Key: is this a key indicator? Used for easy searching and show as
keyon the scorecard. - In the Frequency field, filter the selection of indicator sources by their frequency of data collection.
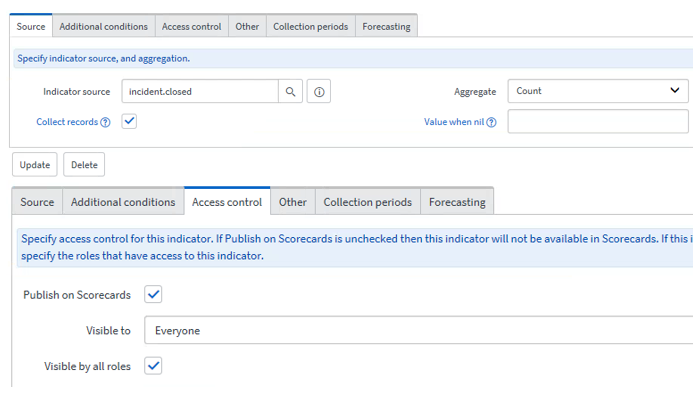
- Collect records:Check if required to view the underlying records on which the score is based from the Detailed Scorecard.
In the
Aggregate field, select theaggregate functionto apply when calculating the indicator on the indicator source.Countcounts the number of records. Count distinct counts the number of unique values rather than the total number of records.An aggregate is an operator which calculates the indicator score.An indicator configuration need to apply an aggregate operation to the indicator source so that a single metric can be obtained as the indicator score.Select one of count,Sum, Average, Minimum,Maximum, Count Distinct.When we calculate the indicator score using any of these operations:sum,Average,Minimum,Maximum or count Distinct,we also need to define the Filed value. - Scripted Aggregate: Alternatively to specifying an aggregate and a filed,we can specify a Script which returns the indicator score.checked the Scripted check box and make a selection in the Script dropdown.
To create Scripts, Navigate to
performance Analytics >Automation>Scripts>Newand entering the script code and properties. Two additional date variables for scripts are available to PA.these arescore_startandscore_endand relate to the collection date in a job scores collection.Value when nil: the value to display when the score in missing - Render continuous lines: If no score is available for a specific date, the date is taken out when the chart is rendered. So there will be no gaps in the chart.So always check Render continuous lines
- Live group profile: The live feed icon becomes visible and is related to the selected live feed group.
- Order:The order the indicator has the scorecard list.If no order is set ,the order is alpha numeric.
- Collection Settings: Select Override collection periods to specify custom retention periods for scores and breakdowns.
- Guided Indicator workflow: The guided indicator workflow allows you to create an automated indicator and its related Breakdowns,data collection job and widgets, using a step by step guided interface.
The benefit of using the guided indicator workflow,in addition to usability,is that non admins can add the indicator to a job and automatically run data collection to collect
historic metricsfor the indicator they are building. - In the Access control tab, set whether to publish this indicator to a scorecard, and whether to
limit the visibilityof the indicator byuser,group, orrole.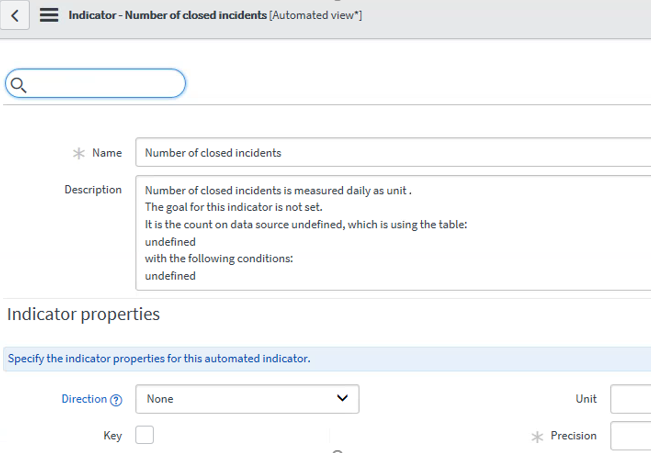
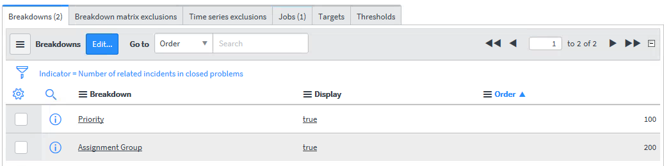
- We have to add Breakdowns to click on Edit button under Breakdown related List
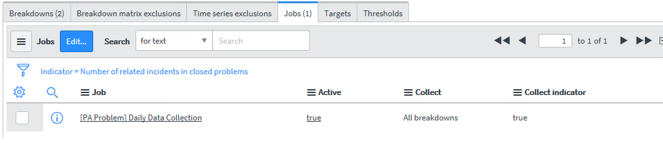
- We have to add Jobs to click on Edit button under Jobs related List.
Read more
- Understanding Request, RITM, Task in ServiceNow
- Steps to create a case in ServiceNow (CSM)
- Performance Analytics in 10 mins
- Event Management in 10 minutes - part1
- Event Management in 10 minutes - part2
- Custom Lookup List
- Script includes in 5 minutes
- Interactive Filter in 5 minutes
- UI Policy in 6 Minutes
- Client Side Script Versus Server Side Script in 3 minutes
-
Snow
- Performance Analytics
- ServiceNow Scripts
- Script include
- Useful scripts
- Basic Glide Scripts
- Client Script
- Advance Glide Script
- Glide System Script
- Admin
- Import Set
- Work Flow
- ACL
- SLA
- Notification
- Core Application
- UI Policy
- UI Action
- Client Script
- CAB Workbech
- Data Policy
- Connect Support
- Catalog
- Discovery
- CSM
- Event Management
- HR
- Integrations
- SSO Integration
- LDAP Integration
- SCCM Integration
- AWS Intergration
- Slack Integration
- CTI Integration
- Jira Integration
- Ebonding ServiceNow
- SOAP Integration
- IBM Netcool Integration
- VIP Mobile App Integration
- Rest Integration
- Service Portal
- Questions
- ACL
- Performance analytics(PA) Interactive Filter
- Various Configurations in Performance analytics(PA)
- Service Portal
- Performance Analytics(PA) Widgets
- Performance Analytics(PA) Indicator
- Performance Analytics(PA) Buckets
- Performance Analytics(PA) Automated Breakdown
- Client Script
- Rest Integration
- Understanding the Request, RITM, Task
- Service Catalogs
- Events in ServiceNow
- Advance glide script in ServiceNow
- CAB Workbench
Author
Chandrima
With 9+ years of ITSM development experience,Chandrima likes to deep dive ServiceNow modules.She have extensively worked on PA,Service Portal,Event management.
Comments