Introduction
Performance Analytics have various metrics which can be be used in combination to create dynamic widgets.Let us learn Time series,Threshold,Element Filter in this post today.
Time series
It apply mathematical aggregations to the indicator data.Time series are predefined and applied to the scorecard.
There are 50 time series definitions provided out of the box.
To view exiting time series definitions,navigate to Performance Analytics > System > Time Series Definitions
There is a special use of the + operator.A plus sign at the end of the time seres indicates that scores for a partially completed period will be included.
Target
Targets are pre-defined numeric values that help measure progress towards a goal.
There are two types of targets
- Global
- Personal
We can set only one global target and one personal target per indicator
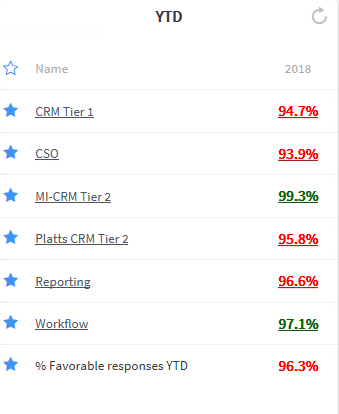
once a target is defined, a target Gap is calculated.The target Gap is based on the Global target for an indicator.When Targets have been defined, they can be shown in widgets to visualize the difference between the actual value of the indicator and the target on dashboards.
Target creation in the scorecard
Scorecard viewers can add target values directly to the Detailed Scorecard following steps:
- Click the target start data point on the
Detailed Scorecard. - Click the
targeticon - Select the type of target
globalorpersonal. - Enter the desired target value into the Target filed,then click save
- The target is immediately added to the Detailed Scorecard.
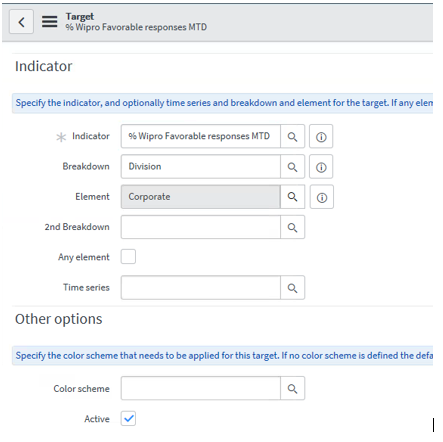
Target form creation
Specify target to define the target score for an indicator at a certain date.
- Navigate to
Performance Analytics > Indicators > Targets. - Click on
New Buttonto create Target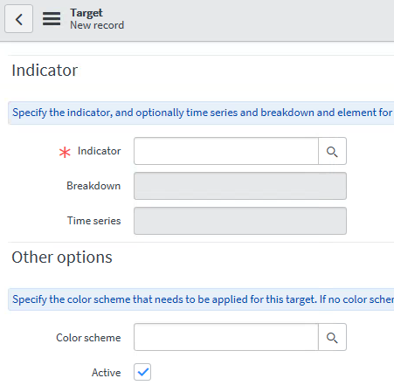
- Select the
Indicatoryou want to set the target for. - Select a
Breakdown. - The Any element check box is selected by default. If you want to select only one element from the breakdown just un-check the
Any element check boxand select the element. Here I have select corporate element from the breakdown Division.
- (Optional) Select a Time series. For example,measure closed incidents daily and set monthly targets for closed incidents.
- (Optional) Select a Color scheme for the target.
- Click Submit.
Set the Target Value
- Select the target you want to add values to.
- In the Target values related list, click New.
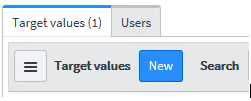
- Specify the target date in the Target at field. A target value is used from the specified start date until the start date for another target value. For example, to set a target per quarter in a year, add four target values, each starting on the first day of the quarter.
- Enter the target Value.

- Click Submit.
The new values appear in the Target values related list on the Target form, and on the target indicator.
Create a target color scheme
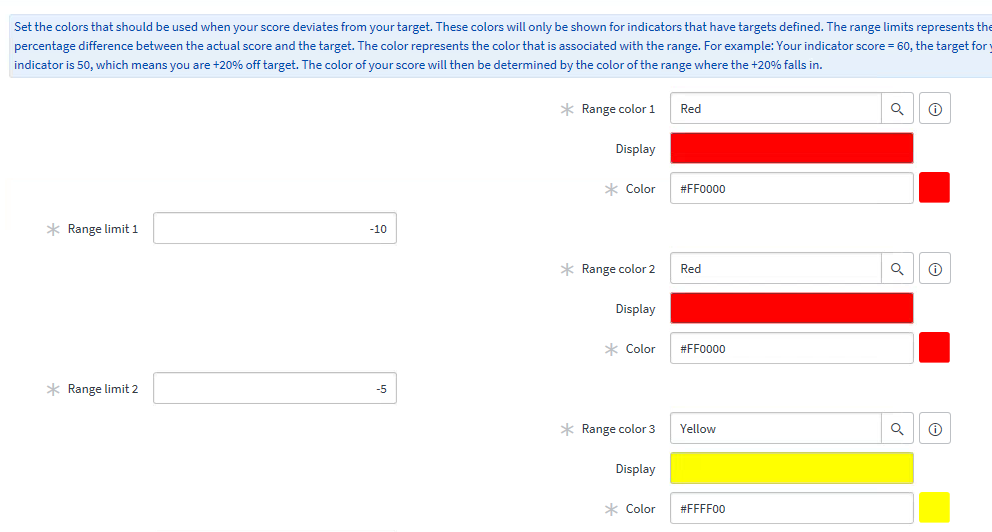
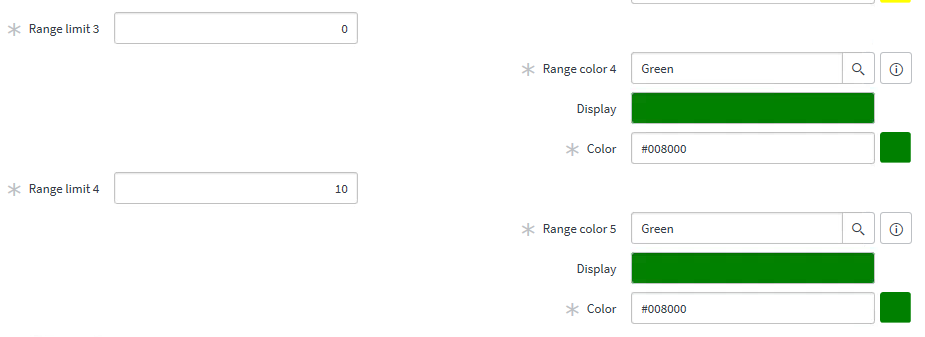
A target color scheme can be used to visualize the position of the indicator score relative to its target.Color scheme allow to apply different colors when scores deviate from the target.Each color has a range limit representing the percentage difference between actual scores and the target.
For example,
If you want to filter the number of open incidents, the scores for an increase of 25% can be shown in red, an increase of 10% in orange, and no change in yellow. Whereas, for example, a decrease by 25% can be shown in dark green. Two target color schemes are available in Performance Analytics by default: the 3-color traffic light and the 5-color traffic light.
Procedure
- Navigate to
Performance Analytics > System > Target Color Schemes.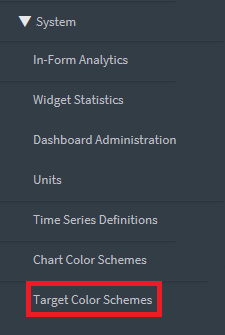
- Click New.
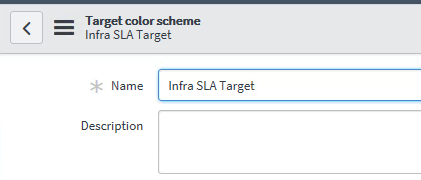
- Enter a Name and a Description.
- Define each of the five ranges and their associated colors. If you do not want to use all the ranges, you can use the same range color for multiple range limits.
- Click Submit.
A Default indicator target color scheme can be set in Performance Analytics > System > Properties. This is used when no color scheme has been selected for an indicator target.
Threshold
Configuring Thresholds result in notifications that let users know when an indicator is approaching a specific Threshold condition.
The following pre-define Threshold condition exist:
- More Than
- Less Than
- All Time High
- All Time Low.
Elements Filter
The list of Breakdown elements can sometimes be long.To help users to easily retrieve and group the elements they are interested in , elements filter can help.
Elements filter allow you to define queries that can be applied to a Breakdown.
To create an elements filter follow the below steps
- Navigate to
performance Analytics >Breakdowns>Elements Filters>New - Enter title and an existing Breakdown source
- Build a filter that applies to the data in the Breakdown source and submit
To visualize the data using this filter
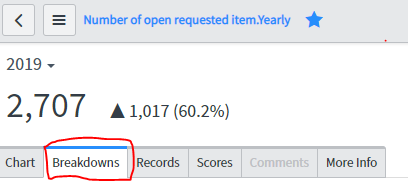
- Navigate to Breakdowns tab on the Detailed Scorecard
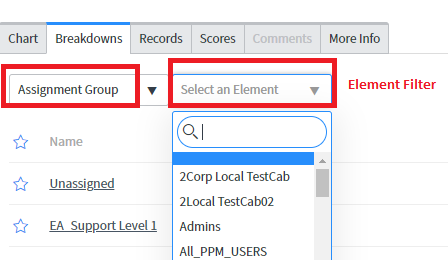
- Select the specific Breakdown(Assignment Group)
- Filter option allow you to select the defined Elements filter(Gorups)
Read More
- Understanding Request, RITM, Task in ServiceNow
- Steps to create a case in ServiceNow (CSM)
- Performance Analytics in 10 mins
- Event Management in 10 minutes - part1
- Event Management in 10 minutes - part2
- Custom Lookup List
- Script includes in 5 minutes
- Interactive Filter in 5 minutes
- UI Policy in 6 Minutes
- Client Side Script Versus Server Side Script in 3 minutes
-
Snow
- Performance Analytics
- ServiceNow Scripts
- Script include
- Useful scripts
- Basic Glide Scripts
- Client Script
- Advance Glide Script
- Glide System Script
- Admin
- Import Set
- Work Flow
- ACL
- SLA
- Notification
- Core Application
- UI Policy
- UI Action
- Client Script
- CAB Workbech
- Data Policy
- Connect Support
- Catalog
- Discovery
- CSM
- Event Management
- HR
- Integrations
- SSO Integration
- LDAP Integration
- SCCM Integration
- AWS Intergration
- Slack Integration
- CTI Integration
- Jira Integration
- Ebonding ServiceNow
- SOAP Integration
- IBM Netcool Integration
- VIP Mobile App Integration
- Rest Integration
- Service Portal
- Questions
- ACL
- Performance analytics(PA) Interactive Filter
- Various Configurations in Performance analytics(PA)
- Service Portal
- Performance Analytics(PA) Widgets
- Performance Analytics(PA) Indicator
- Performance Analytics(PA) Buckets
- Performance Analytics(PA) Automated Breakdown
- Client Script
- Rest Integration
- Understanding the Request, RITM, Task
- Service Catalogs
- Events in ServiceNow
- Advance glide script in ServiceNow
- CAB Workbench
Author
Chandrima
With 9+ years of ITSM development experience,Chandrima likes to deep dive ServiceNow modules.She have extensively worked on PA,Service Portal,Event management.
Comments