Introduction
The ServiceNow Dashboards product enables you to display multiple Performance Analytics, reporting, and other widgets on a single screen. It’s a multiple tab home page. It helps to view large scale of data in various projections. We can control visibility by user role. We can create a new dashboard and create tabs like Incident, Problem, Change. We can add and configure, style widgets in dashboard.
Dashboards work much the same way as Homepages.
Multiple tabs may be added to dashboards.
Tab allow you to logically group widgets that belong together.
Dashboard types
There are two kinds of Dashboards
- Standard
- Breakdown
A breakdown Dashboard is different from a standard Dashboard because a filter can be selected in the title bar that quickly filter all the widgets on each of its tabs.
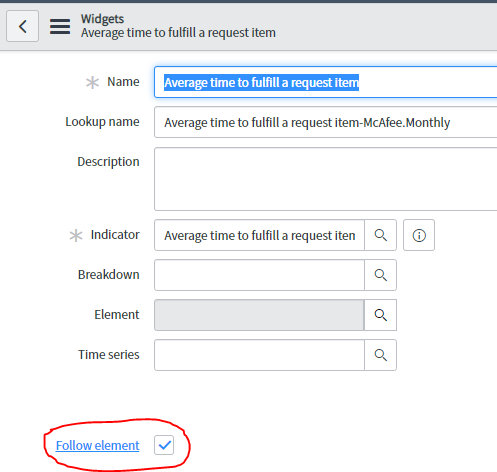
The Follow element must be activated for each widget in order to filter appropriately
Using breakdowns on dashboards
To follow the procedure look at the below link:
- Understanding Request, RITM, Task in ServiceNow
- Steps to create a case in ServiceNow (CSM)
- Performance Analytics in 10 mins
- Event Management in 10 minutes - part1
- Event Management in 10 minutes - part2
- Custom Lookup List
- Script includes in 5 minutes
- Interactive Filter in 5 minutes
- UI Policy in 6 Minutes
- Client Side Script Versus Server Side Script in 3 minutes
-
Snow
- Performance Analytics
- ServiceNow Scripts
- Script include
- Useful scripts
- Basic Glide Scripts
- Client Script
- Advance Glide Script
- Glide System Script
- Admin
- Import Set
- Work Flow
- ACL
- SLA
- Notification
- Core Application
- UI Policy
- UI Action
- Client Script
- CAB Workbech
- Data Policy
- Connect Support
- Catalog
- Discovery
- CSM
- Event Management
- HR
- Integrations
- SSO Integration
- LDAP Integration
- SCCM Integration
- AWS Intergration
- Slack Integration
- CTI Integration
- Jira Integration
- Ebonding ServiceNow
- SOAP Integration
- IBM Netcool Integration
- VIP Mobile App Integration
- Rest Integration
- Service Portal
- Questions
- ACL
- Performance analytics(PA) Interactive Filter
- Various Configurations in Performance analytics(PA)
- Service Portal
- Performance Analytics(PA) Widgets
- Performance Analytics(PA) Indicator
- Performance Analytics(PA) Buckets
- Performance Analytics(PA) Automated Breakdown
- Client Script
- Rest Integration
- Understanding the Request, RITM, Task
- Service Catalogs
- Events in ServiceNow
- Advance glide script in ServiceNow
- CAB Workbench
Author
Chandrima
With 9+ years of ITSM development experience,Chandrima likes to deep dive ServiceNow modules.She have extensively worked on PA,Service Portal,Event management.
Comments