Introduction
Scorecards display data for a single indicator. Scorecards enable you to gain insights on how indicator scores broken down by different dimensions change over time.
Scorecards are categorized to Best, Worst, Improved, Degraded, All.
Best: Shows indicators that are outperforming their target (green), ordered by Gap % (best performers on top).
Worst: Shows indicators that are under performing their target (red), ordered by Gap % (worst performers on top).
Improved: Shows indicators that have improved compared to the previous data collection (moving in the right direction).
Degraded: Shows indicators that have degraded compared to the previous data collection (moving in the wrong direction).
A solid blue star beside an indicator name indicates that it is a favorite. Click the star beside the scorecard to mark it as a favorite.
A black dot beside an indicator name indicates that it is a key indicator. Mark indicators as key by selecting the Key check box when creating the indicator.
We can select details of individual KPI and select target value and date.To customize the scorecards list, click the list settings icon beside the list header search box.
We can apply filters and breakdowns, and control which columns appear in the scorecards list.The condition filter at the top of the list displays any currently-selected filter options. You can remove, but not add filter conditions using this filter.
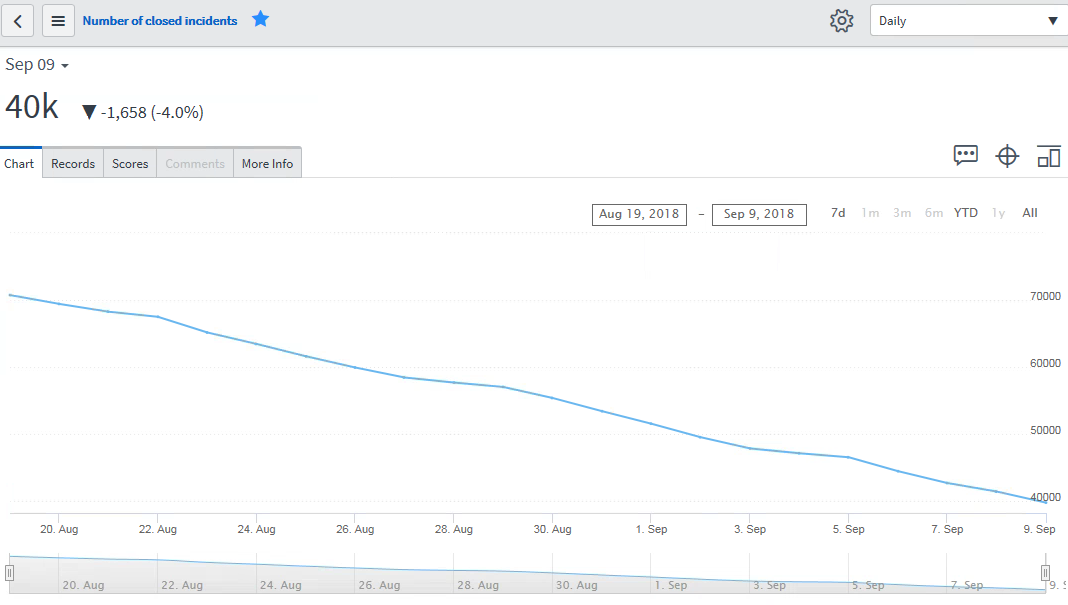
In details section we have chart, Breakdowns, Comments and More Info section.
We can set the direction of the data trend.We can use scorecard data in Dashboard
Steps to configure Scorecard
- To access the list of scorecards, navigate to
Performance Analytics > Scorecards.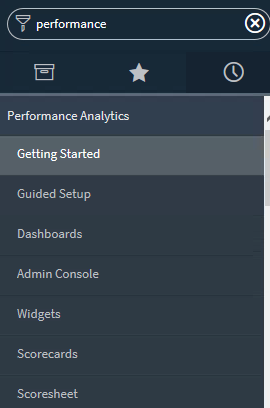
- Click on “All” to search all the KPIs and look for
Number of closed incident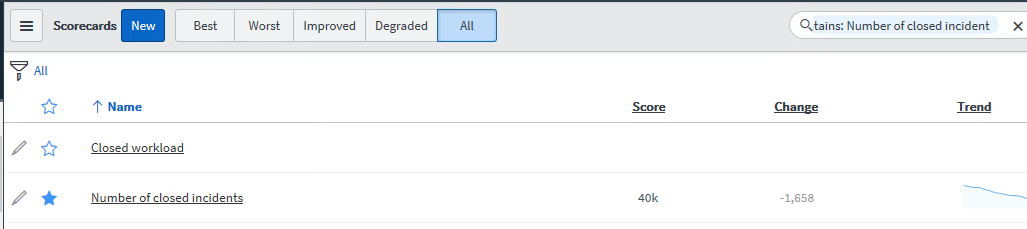
- Click on the KPI and it will display the KPI in details.
- It has below sections Charts, Records, Scores, More Info.
Read More
- Understanding Request, RITM, Task in ServiceNow
- Steps to create a case in ServiceNow (CSM)
- Performance Analytics in 10 mins
- Event Management in 10 minutes - part1
- Event Management in 10 minutes - part2
- Custom Lookup List
- Script includes in 5 minutes
- Interactive Filter in 5 minutes
- UI Policy in 6 Minutes
- Client Side Script Versus Server Side Script in 3 minutes
-
Snow
- Performance Analytics
- ServiceNow Scripts
- Script include
- Useful scripts
- Basic Glide Scripts
- Client Script
- Advance Glide Script
- Glide System Script
- Admin
- Import Set
- Work Flow
- ACL
- SLA
- Notification
- Core Application
- UI Policy
- UI Action
- Client Script
- CAB Workbech
- Data Policy
- Connect Support
- Catalog
- Discovery
- CSM
- Event Management
- HR
- Integrations
- SSO Integration
- LDAP Integration
- SCCM Integration
- AWS Intergration
- Slack Integration
- CTI Integration
- Jira Integration
- Ebonding ServiceNow
- SOAP Integration
- IBM Netcool Integration
- VIP Mobile App Integration
- Rest Integration
- Service Portal
- Questions
- ACL
- Performance analytics(PA) Interactive Filter
- Various Configurations in Performance analytics(PA)
- Service Portal
- Performance Analytics(PA) Widgets
- Performance Analytics(PA) Indicator
- Performance Analytics(PA) Buckets
- Performance Analytics(PA) Automated Breakdown
- Client Script
- Rest Integration
- Understanding the Request, RITM, Task
- Service Catalogs
- Events in ServiceNow
- Advance glide script in ServiceNow
- CAB Workbench
Author
Chandrima
With 9+ years of ITSM development experience,Chandrima likes to deep dive ServiceNow modules.She have extensively worked on PA,Service Portal,Event management.
Comments