Introduction
Service Now Event Management (SN EM) automatically creates actionable alerts from events captured by third-party monitoring tools like Nagios/Solarwind/Vrops.
Event management is the process that monitors all events that occur through the IT infrastructure. It allows for normal operation and also detects and escalates exception conditions.A configurable dashboard provides a consolidated view of all service-impacting events, including a list of current active alerts, impacted services, and associated incidents.
In order to generate qualified alerts, events are processed through filters that normalize and de-duplicate the incoming stream. Alerts are then mapped to configuration items (CIs) in the Service Now Configuration Management Database (CMDB) and rules may be applied to trigger automated actions.
Architecture
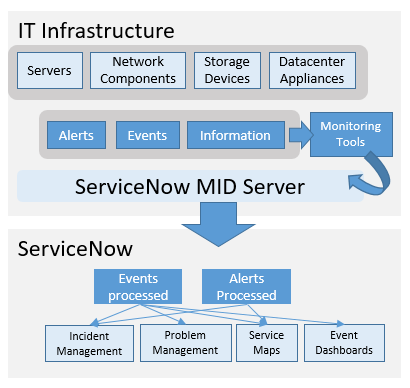
Events, alerts, and information are generated from IT infrastructure continuously, these generated events needs to be addressed appropriately and acted upon.
ServiceNow Event Management application helps to manage alerts and events that are escalated from different IT infrastructure components or configuration items.
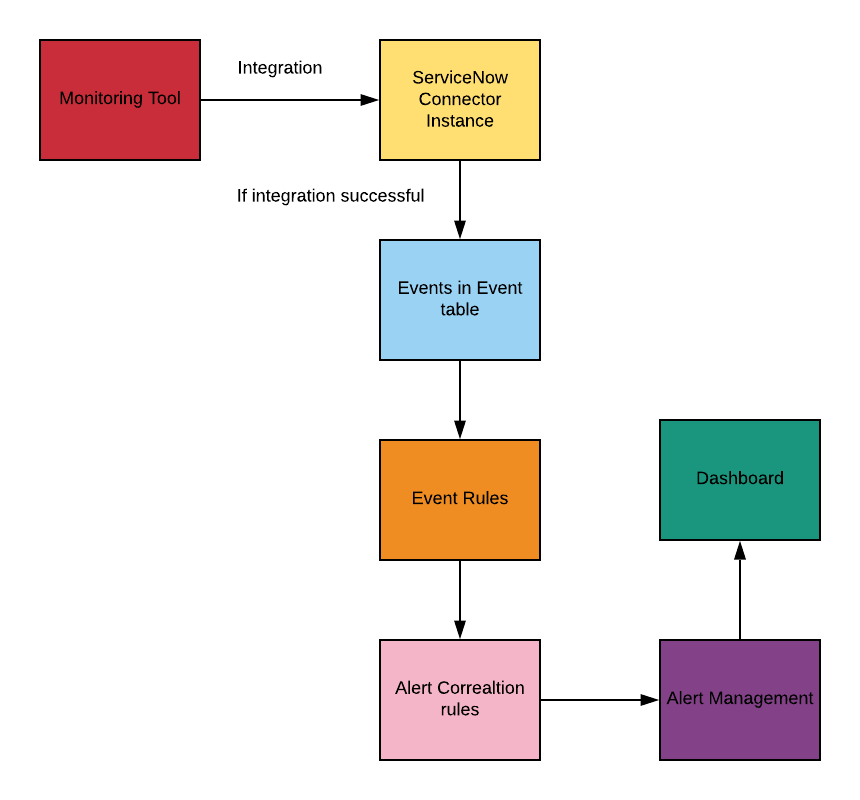
| Term | Description |
|---|---|
| Events | Events are generated by various infrastructure components and monitoring software |
| Connection Instances | Connection to various event monitoring software |
| Event rules | How to handle the events that are generated |
| Event field mappings | Mapping values or fields generated by the different event sources and the mapping to the ServiceNow event fields |
| Alert correlation rules | When to generate alerts and how to consolidate them |
| Alert Management | Action that needs to be taken on the alerts generated |
| Dashboards | Overview of all the alerts generated users are able to take appropriate remediation actions from the dashboards |
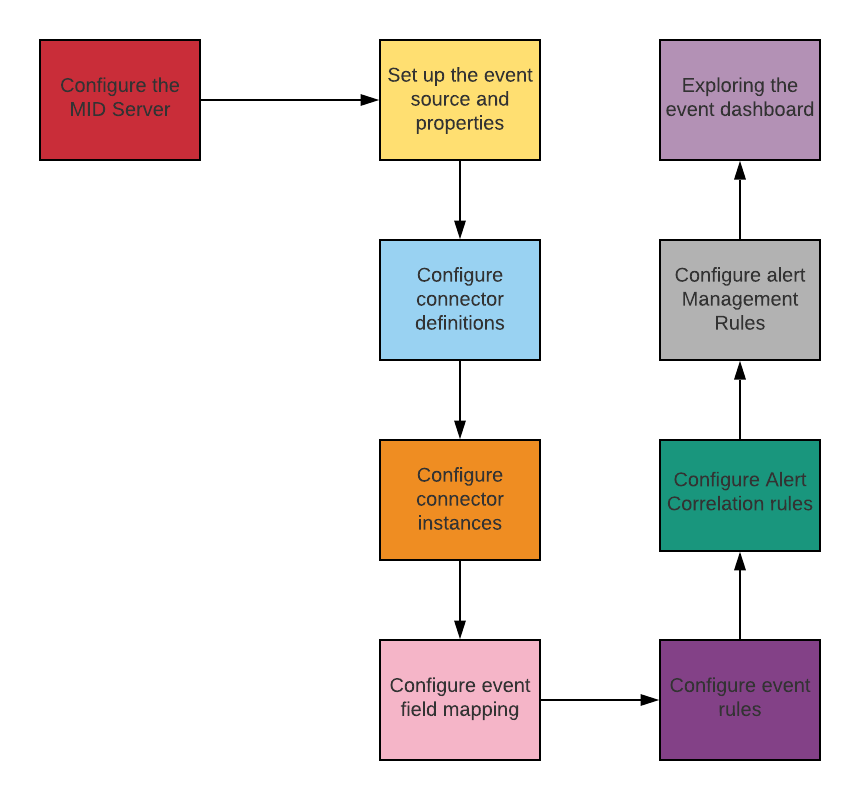
Below are the steps to configure and setup the event management application
Event properties setup
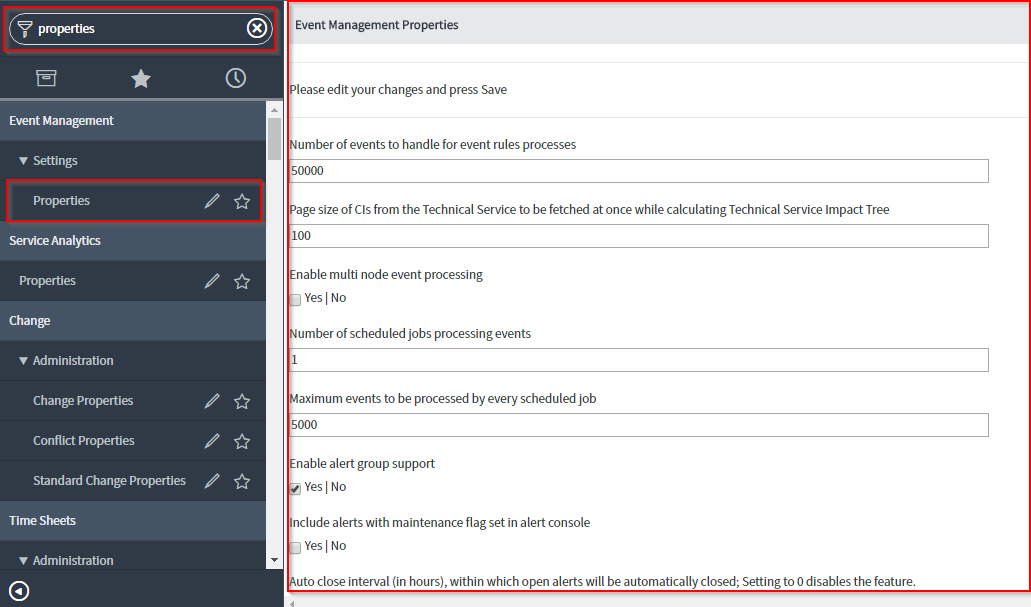
Event properties are settings for the event management applications. To set properties type properties on the application navigator. Select Event Management Settings Properties to open up a window to enter the properties.
Below are some key properties
- The number of events to handle for event rules processes
- The maximum number of events to be processed by every scheduled job
- Whether multi-node event processing is enabled
- The number of scheduled jobs processing events
- The maximum number of events to be processed by every scheduled job
- Whether alert group support is enabled
- An auto close interval (in hours), within which open alerts will be automatically closed
- Setting to 0 disables the feature
- Timeout for the impact calculation (in minutes)
- A flap interval (in seconds), within which an alert enters the flapping state. Sometimes the event sources continues to generate events even after the associated alert is closed this is called flapping. This causes to fluctuate the status of the reporting resource.
- Acknowledge an alert when manually closing it
- Closing alerts will Resolve incident and close incident
- Reopening alerts will Create new incident and reopen incident
Connector definition configuration
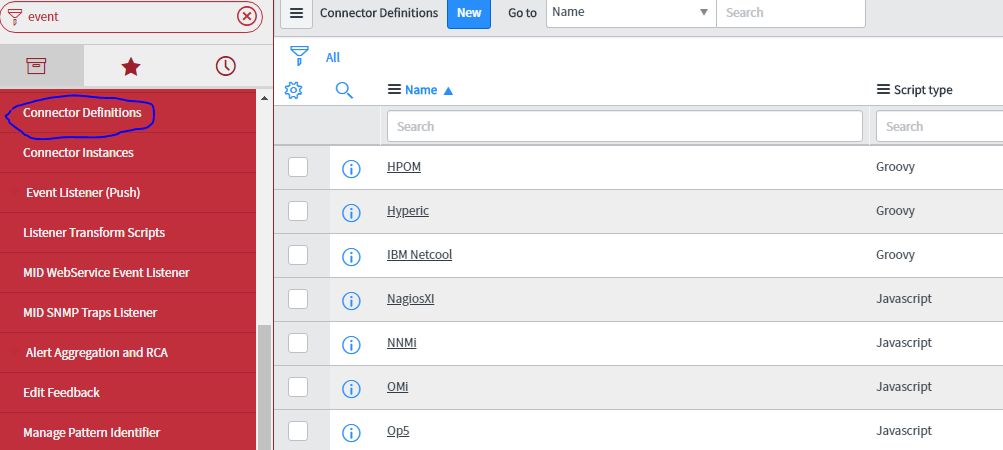
A connector definition specifies an event source to retrieve events from the defined event source.From the left navigator type connector definitions and click on Connector Definitions under
Event Management ->Connectors
We have an option to create a new connector definition. You can fill in the required fields
| Term | Description |
|---|---|
| Name | The name of the events monitoring software |
| Script type | The script type to run |
| Connector Parameters | Attributes to communicate with the event monitoring software |
| MID server capability | The MID Server to utilize for processing |
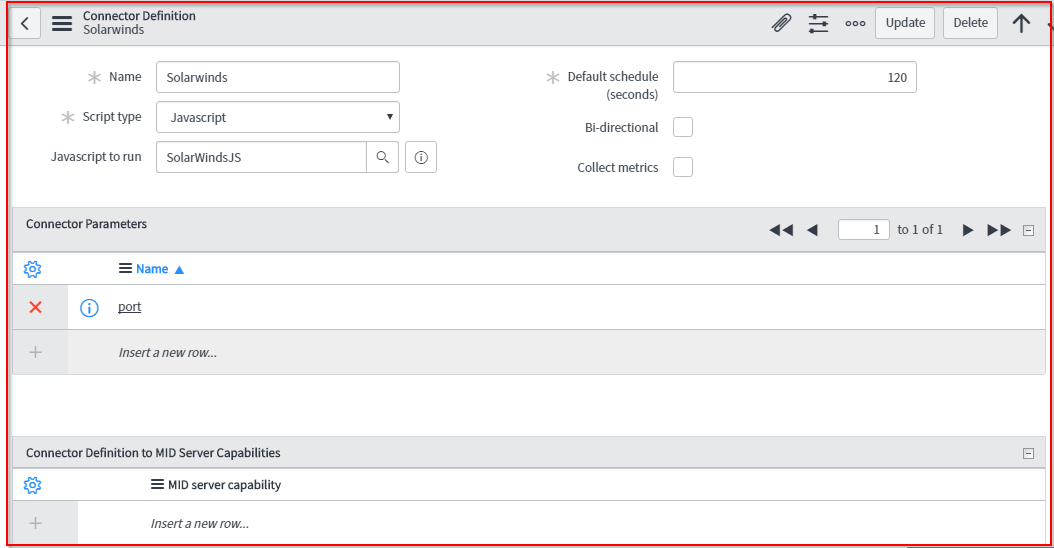
Once the credentials and connector definitions are entered, we can click Submit to create the connector instance.
Configuring a connector instance
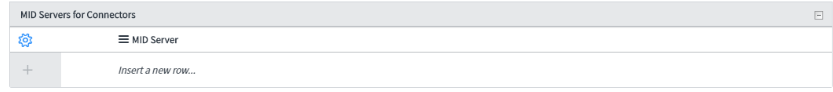
The MID Server gets the instructions through the connector instances to obtain event-related information based on the individual event source.Below are the steps to create connector instance
- On the application navigator type, connector Instances and then click Connector Instances under Event Management-> Connectors.
- Clicking on New opens up a form to create a new connector instance. The following mandatory fields need to be filled to create a connector instance:
- Name: The name of the connector instance
- Host IP: The IP of the event host
- Credential: Credentials to logon to the event monitoring tool
- Connector definition:The connector type, you can choose whether to select connector definition out of box or create a new connector definition
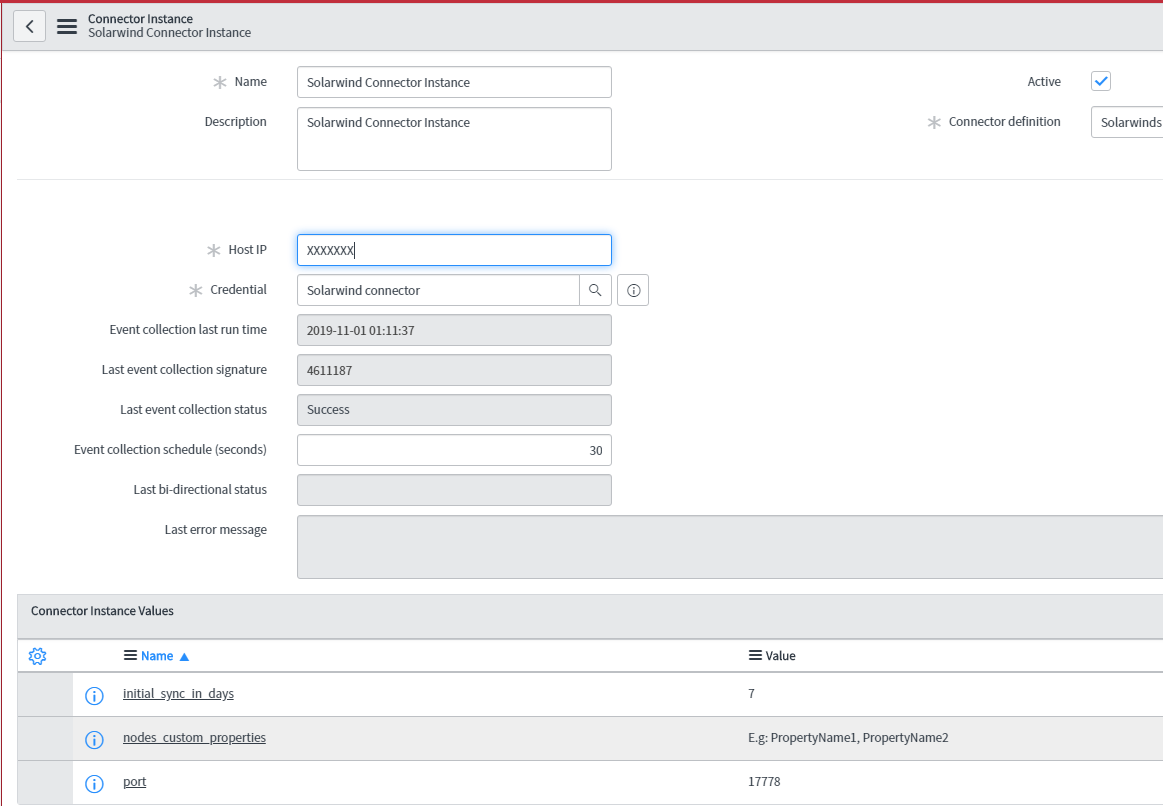
Credential and Connector definition needs to be configured separately. You can see the progress of the connector test
Event rules
Event rules are there to generate alerts based on a specific condition that must satisfy before or after an action is taken.Event rules specifies the alerts to generate when a specific event rule criteria is met.
If the event cannot be parsed by existing event rules, it will come in the top of event_rule table as recommendation.We can create rules based on this recommendation
Each Event rule have the following steps

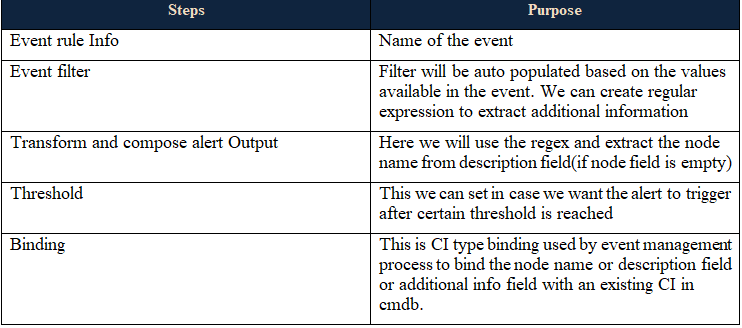
To configure event rule, type event rules on the application navigator and click on Event Rules under Event Management -> Rules. A list of existing event rules opens on the right pane. By clicking on the New button, you can create a new event rule.
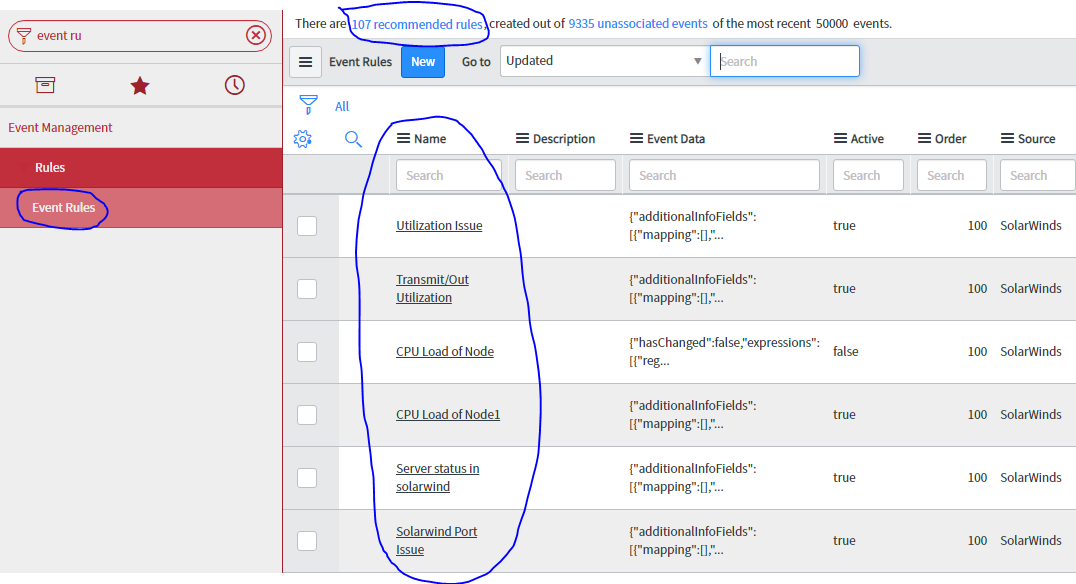 We can ckick on recommended rules and creates event rules
Event field mappings
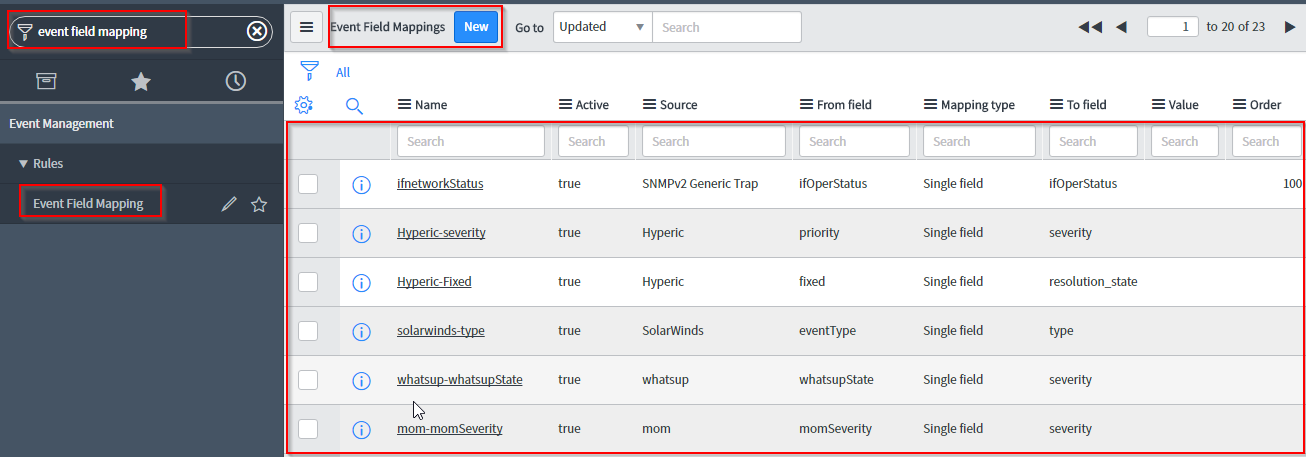
When events are generated from different event sources, the incoming event source value might be different than the value in event management application. Event field mapping helps to identify which field from event source maps to which field in ServiceNow table. Once the event rules are executed, the event field mapping occurs and then the alerts are generated. Follow the steps for creating event field mappings.
From the application navigator type event field mapping, then click on Event Field Mapping under Event Management–>Rules to list all the existing Event Field Mappings.
Alert correlation rules
When events are generated and event rules are triggered, alerts are generated. There might be alerts which are related to one another like your service maps, the CI relationship where a parent CI or business services have all the downstream CI mapped below them. Similarly, there might be a parent alert and the underlying alerts might be related to them because the parent alert is generated it is expected that the child alert will get triggered.
For example, in a network environment, you have a main router and there are many other sub routers and switches and pieces of network equipment associated to the network. When the main network goes down, it is expected that other network equipment is not going to work.
Alert correlation rules are used for this exact purpose to classify the alerts and create relationships between them. By identifying the primary and secondary, we can identify which alerts to suppress and pay attention to the important alerts.
Based on the CI relationship in the CMDB, a rule is established on primary and secondary alerts. There are different relationships that can be provided that include:
| Type | Description |
|---|---|
| None | Do not create relationship between primary and secondary alert |
| Same CI | Primary and Secondary alerts need to be related to the same CI |
| Parent to Child | Alert has a parent child relationship similar to CMDB |
| Child to Parent | Alert relationship is a childparent CI relationship similar to the relationship in the CMDB |
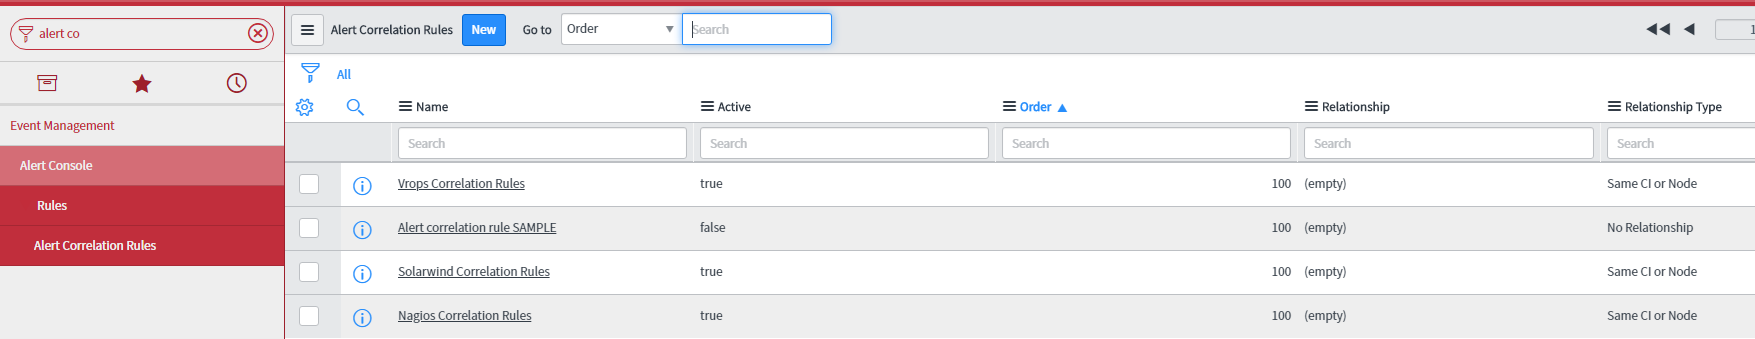
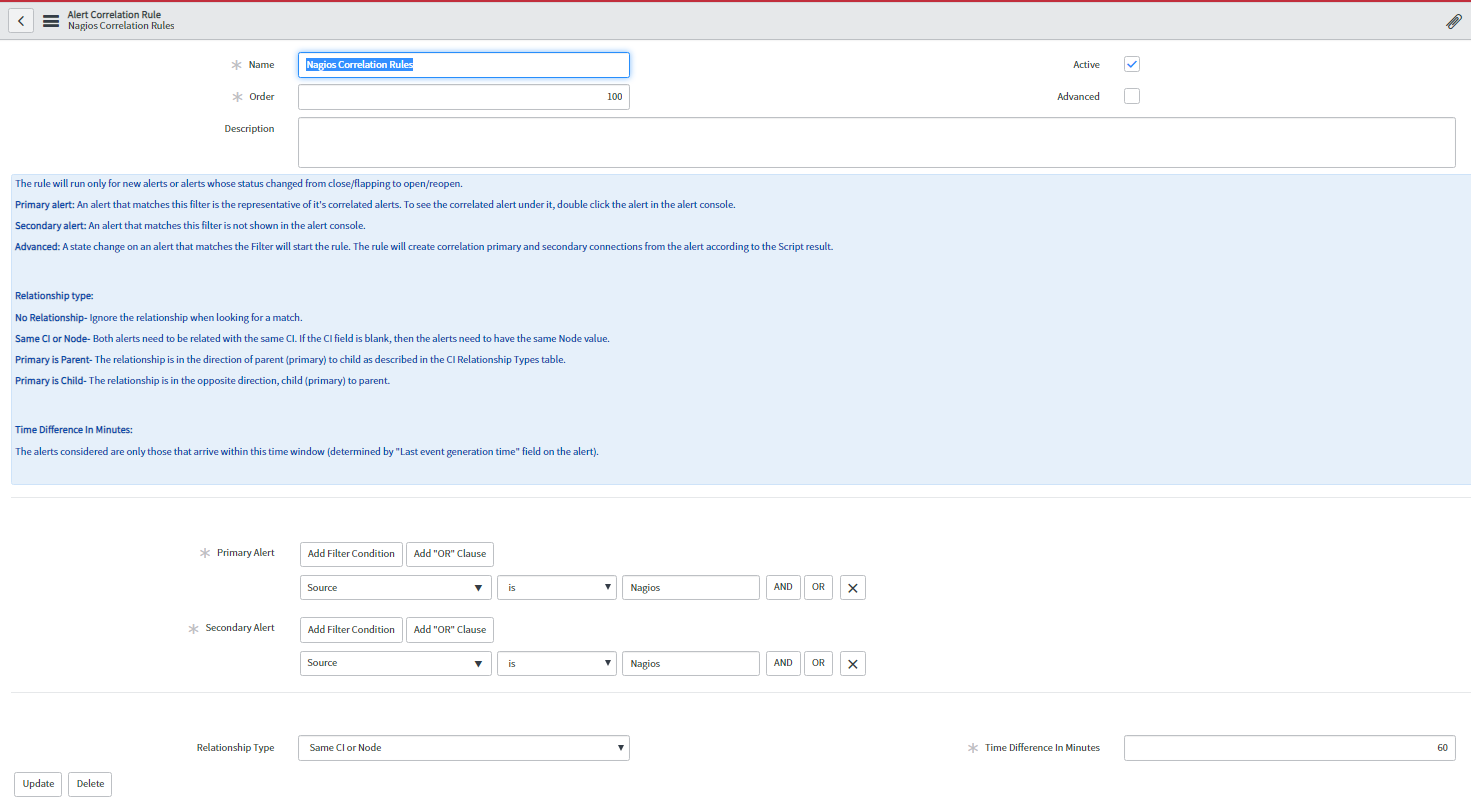
To create an Alert Correlation Rules, type Correlation on the application navigator, then click on Correlation Rules under Event Management->Rules. Clicking on New button next to Alert Correlation Rules will help to create a new alert correlation rule.
Clicking on configure opens a window to configure Alert Correlation Rules and clicking on New opens a form to create a new Alert Correlation Rule. Some of the important field are as follows:
| Field | Description |
|---|---|
| Name | A meaningful name for the correlation rule. For example: Storage Limit |
| Order | The priority for the rule execution |
| Description | Rule description |
| Primary Alert | Filter condition to identify the primary alert |
| Secondary Alert | Filter condition to identify the secondary alert |
| Relationship Type | Type of relationship between primary and secondary alert |
Once completed right-click on the header of the form and click Save to complete the alert correlation rule.
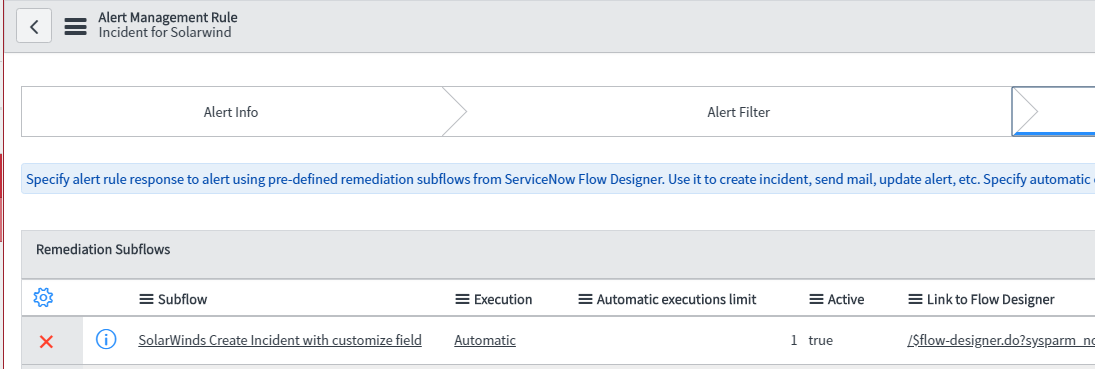
Alert Management Rule
Alerts are picked up by alert management rule based on following criteria
- Lower order are executed first
- Match filter to pick alert.
- In action we can select the remediation sub flow that we want to trigger when this alert is raised.
- We can create an incident when the alert is triggered
- We can customize the fields that will get populated in the incident table. We can do this by script or by task template. Script is preferred as we can dynamically set values.
Look here for Flow designer configuration and here
Copy and Modify Create Incident Subflow
- Navigate to Flow Designer-> subflows
- We provide an OOB Create Incident Subflow. It is recommended to make a copy of the OOB subflow template instead of creating a new subflow from scratch. To copy the subflow, follow these steps:
- Open the Create Incident subflow
- Expand the More Actions and select copy subflow
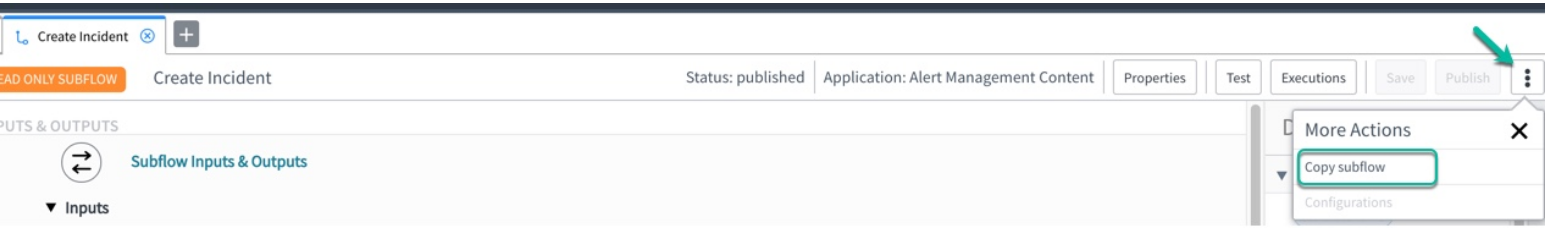
- Give the new subflow a name and set application = Global
- Click Copy
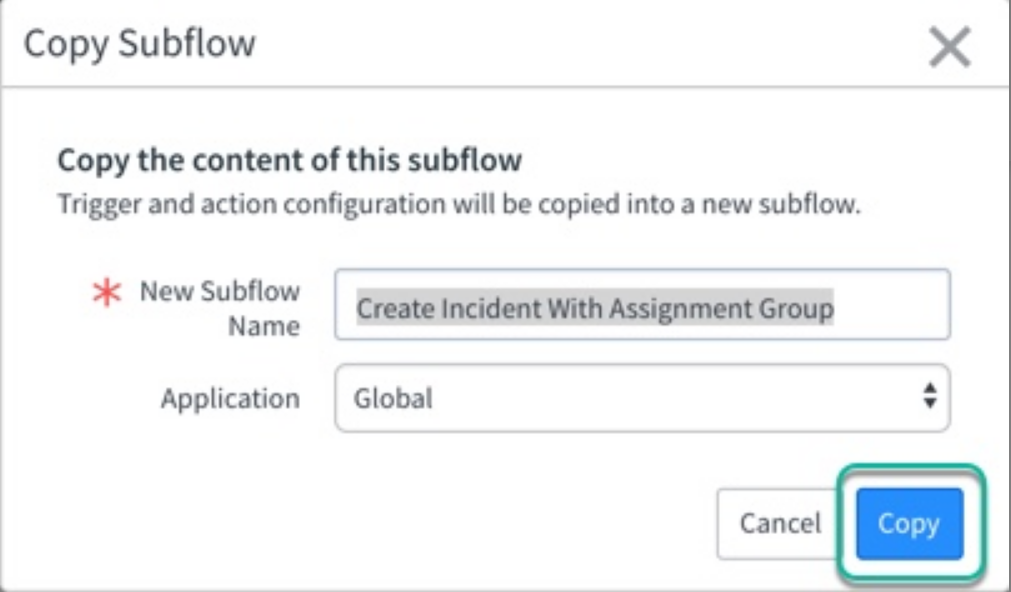
- In the Subflows tab, you will see the flow is created with the Status = Draft

- Review and modify the new subflow as follow:
- Navigate to the subflows tab -> click to open your newly created subflow. (example: Create Incident with Assignment Group)
- Scroll down to the Create Task step and click to open it.
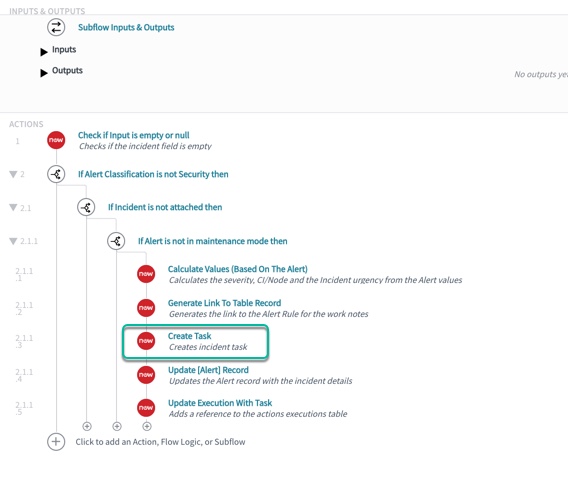
- The default create task for the incident table will already be pre-populated with some field values. In this example, I want to set the CI’s support group to the incident record’s assignment group field follow these steps.
- Click the add field value and select assignment group from the drop-down
- Next, select the data pill picker and pick
Subflow input -> alertGR -> Configuration Item -> support group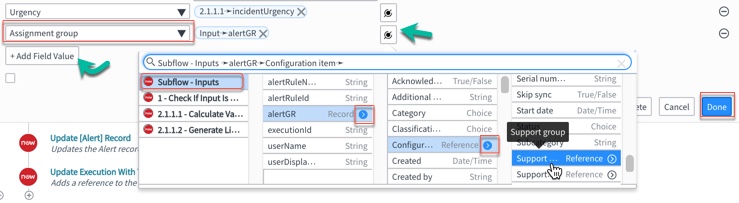
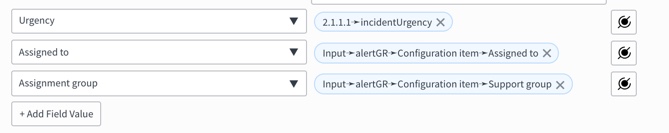
- Click Done. You can add other fields by repeating the above steps. like assigned to and the result should look something like this screenshot.
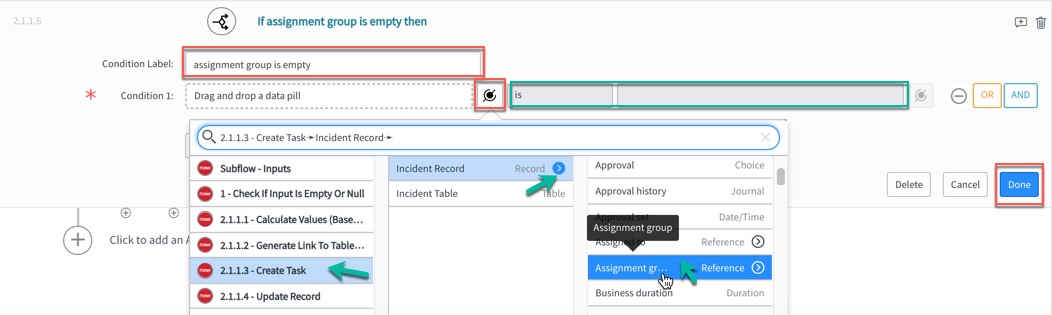
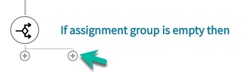
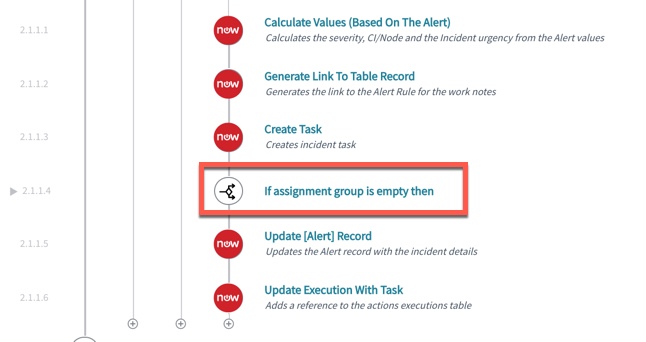
- Next, I add an if flow logic to check for an empty assignment group as follow.
- Set Condition Label = assignment group is empty
- Set Condition 1 as shown in the screenshot by using the data pill picker
- You want to select create task
- Select Incident record
- Select assignment group
- is and leave the field blank (blank = Null/Empty)
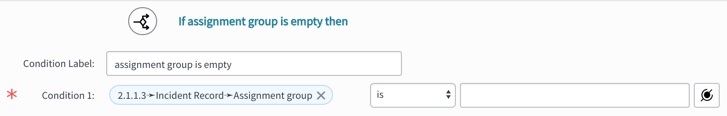
- Click Done
- The result
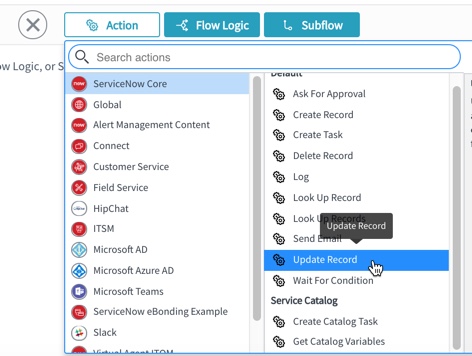
- Next under the if section click the + icon
- Select Action -> ServiceNow Core -> Update Record
- Use the drop-down or Data Pill Picker to fill in the form as below:
        Action = Update Record
        Record = Incident Record
        Table (incident table will automatically fill in)
        Set Fields to Assignment Group = Technical Support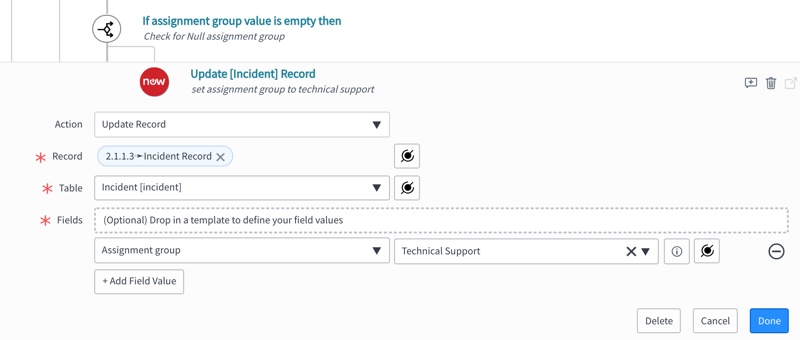
- Moving if flow logic to the step right after Create Task.
When you add an action or flow logic to an existing subflow, it adds the step at the end of the subflow so you have to move it. To do this, hold your left mouse button down and drag the if flow logic in between the Create Task and Update [Alert] Record, then release your left mouse button.
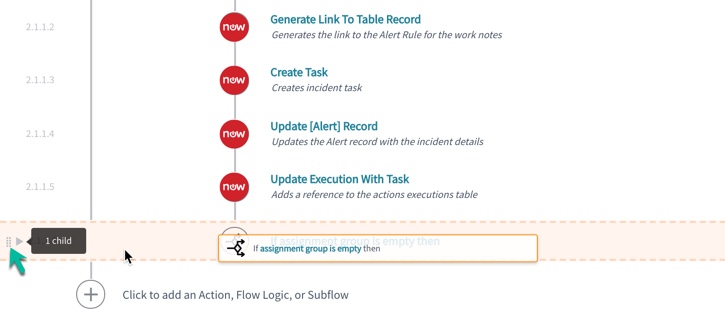
- The result
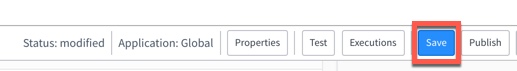
- Finally, Save, test, and publish the subflow
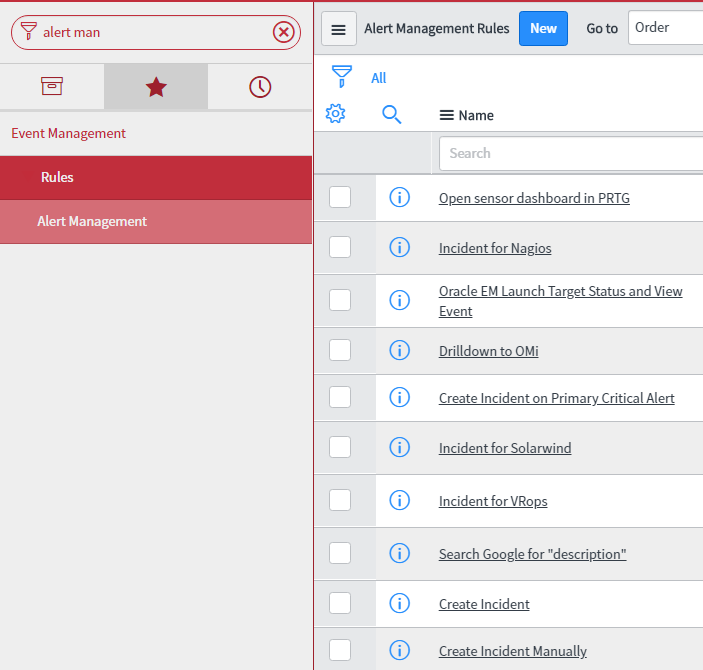
Calling the subflow from the Alert Management
Navigate to
Event Management -> Rules -> Alert Management
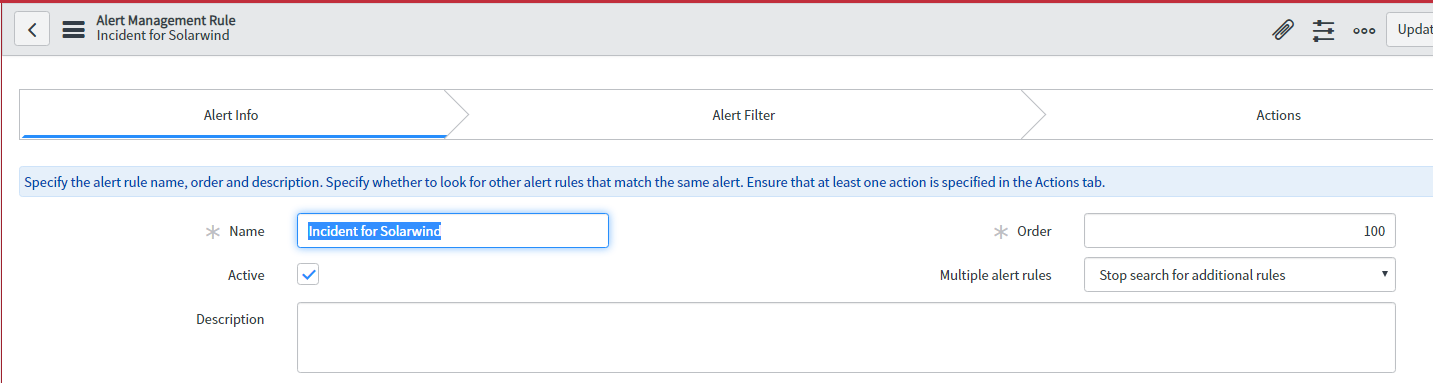
- Click on the New button to create a new Alert Management Rule
- Fill in the name, order number, and check the active box
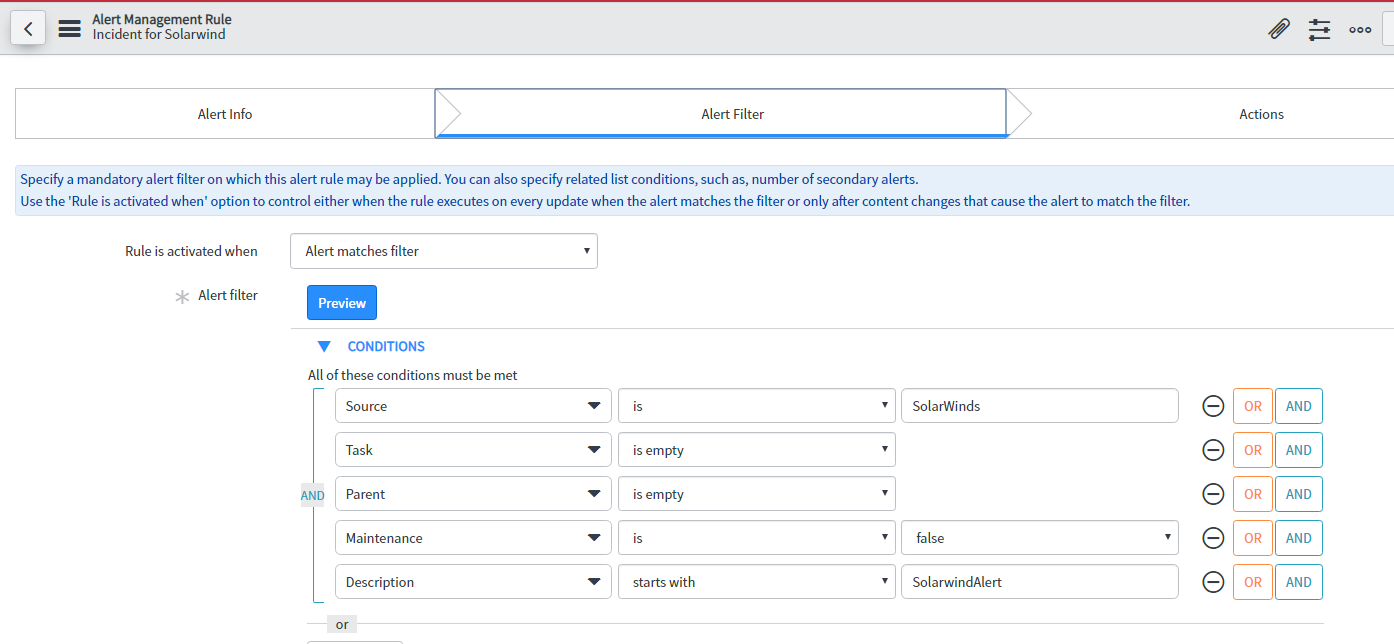
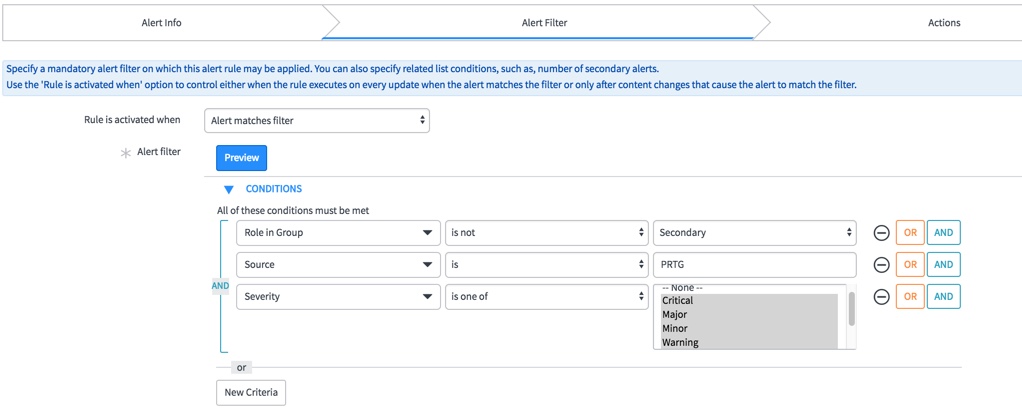
- Click on the Alert Filter and set the following conditions:
- The rule is activated when: Alert matches filter
- Add an alert filter you like. For example, Severity is one of: Warning, Minor, Major Critical or something like screenshot below
- Next click on the Actions tab and double click in the Subflow field. (Make sure you are in the Remediation Subflows section on the form) Enter Create Incident with assignment group (or whatever name you use)
- Click Submit
BSM Map
Additionally we can view impacted CI in BSM map in Event management. We can visualize the event impacting our IT services using event dashboard. We can create an application service/technical service with CI topology we are concerned with.
We can set the business criticality of this service, based on that the event dashboard will show the priority
- Understanding Request, RITM, Task in ServiceNow
- Steps to create a case in ServiceNow (CSM)
- Performance Analytics in 10 mins
- Event Management in 10 minutes - part1
- Event Management in 10 minutes - part2
- Custom Lookup List
- Script includes in 5 minutes
- Interactive Filter in 5 minutes
- UI Policy in 6 Minutes
- Client Side Script Versus Server Side Script in 3 minutes
-
Snow
- Performance Analytics
- ServiceNow Scripts
- Script include
- Useful scripts
- Basic Glide Scripts
- Client Script
- Advance Glide Script
- Glide System Script
- Admin
- Import Set
- Work Flow
- ACL
- SLA
- Notification
- Core Application
- UI Policy
- UI Action
- Client Script
- CAB Workbech
- Data Policy
- Connect Support
- Catalog
- Discovery
- CSM
- Event Management
- HR
- Integrations
- SSO Integration
- LDAP Integration
- SCCM Integration
- AWS Intergration
- Slack Integration
- CTI Integration
- Jira Integration
- Ebonding ServiceNow
- SOAP Integration
- IBM Netcool Integration
- VIP Mobile App Integration
- Rest Integration
- Service Portal
- Questions
- ACL
- Performance analytics(PA) Interactive Filter
- Various Configurations in Performance analytics(PA)
- Service Portal
- Performance Analytics(PA) Widgets
- Performance Analytics(PA) Indicator
- Performance Analytics(PA) Buckets
- Performance Analytics(PA) Automated Breakdown
- Client Script
- Rest Integration
- Understanding the Request, RITM, Task
- Service Catalogs
- Events in ServiceNow
- Advance glide script in ServiceNow
- CAB Workbench
Author
Chandrima
With 9+ years of ITSM development experience,Chandrima likes to deep dive ServiceNow modules.She have extensively worked on PA,Service Portal,Event management.
Comments